
Benchmarking RISC-V: VisionFive 2 vs the world
This post is part of the Upstream RISC-V serie:
- The upstream RISC-V experience: running RISC-V hardware with upstream distros
- VisionFive 2
- BananaPi BPI-F3
Introduction
I recently got my "super early bird" version of the VisionFive 2 RISC-V board. As the documentation says, it is supposed to be "the world’s first high-performance RISC-V single board computer (SBC) with an integrated GPU".
Since I have access to several kind of RISC-V, ARM and x86 boards, let's see if the claim about performance is true! We will look both at processing performance and energy efficiency.
Updated 2023-01-22: added Kobol Helios64 performance results from Max
Updated 2023-01-23: added results (performance and power) for Raspberry Pi 3B+
Updated 2023-01-24:
- re-done all SBC power measurements, significant changes for VisionFive 2
- fixed completely incorrect performance measurements for Raspberry Pi 3B+ caused by a faulty USB cable (causing a huge 2.5x drop in performance!)
- re-done measurements for Raspberry Pi 1 with Debian 11 and without the faulty USB cable
- added results for Raspberry Pi 3B, it was not fried after all, it was also the faulty USB cable
- re-done Raspberry Pi 4 power measurements to be more comparable (avoid POE)
Updated 2024-05-15: added Raspberry Pi 5 performance results from Denis
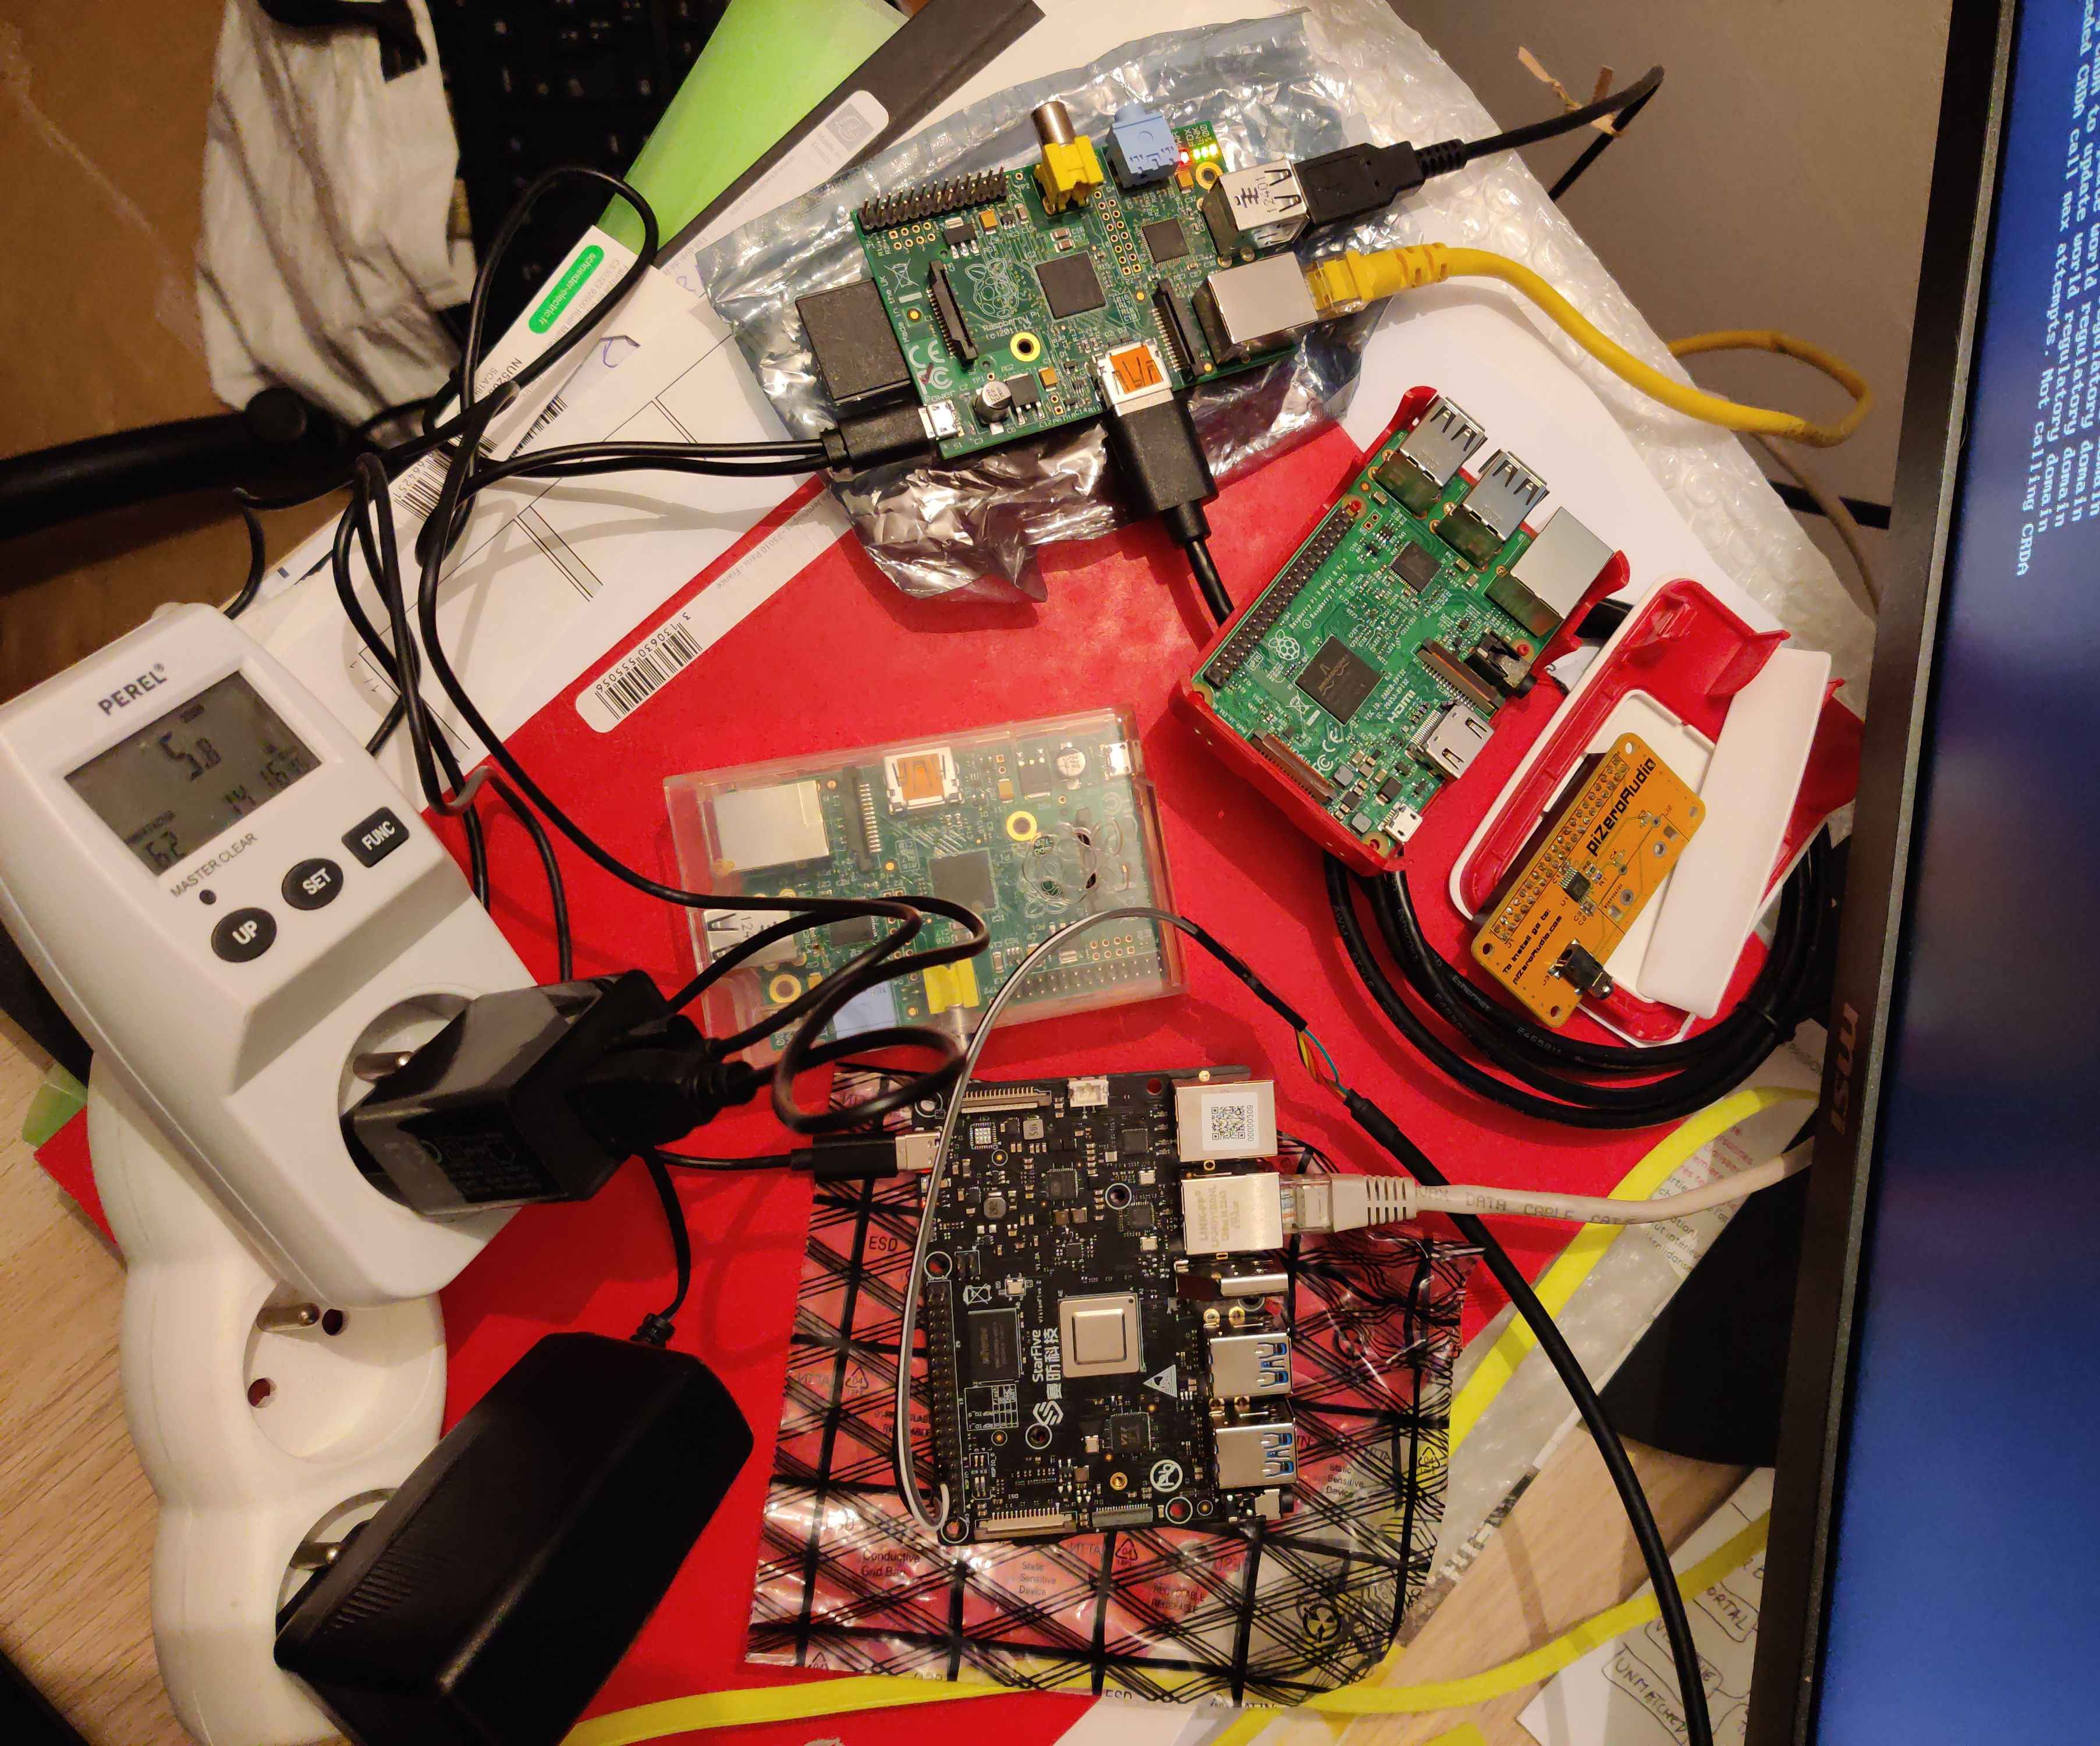
Power measurement setup. The VisionFive 2 is visible at the bottom with its serial cable, the wattmeter is on the left. The other visible boards are Raspberry Pis.
A disclaimer on methodology
Benchmarking CPU performance correctly requires a huge software and
hardware expertise, and I can certainly not claim to have such an
expertise. I have chosen two basic computing primitives, hoping that they
are representative enough: crypto (sha1 and chacha20-poly1305 using
openssl) and decompression (xz).
All numbers shown in this article are very "unscientific": I made no formal repetition to account for variability, and there are many factors that I purposefully ignore (kernel version, software version, compiler...). That being said, I tried to document these parameters as much as possible to help further analysis.
Overall, the goal is to give a rough idea of the CPU performance and power efficiency you can expect from RISC-V hardware.
Hardware and software environment
The VisionFive 2 has a StarFive JH7110 SoC, with 4 SiFive U74 cores at 1.5 GHz.
The original VisionFive had a StarFive JH7100 SoC with 2 SiFive U74 cores at 1.2 GHz. It had known hardware design issues: frequent L2 cache flushing needed because of a non-coherent bus and a slow RAM controller. So, the new SoC should be significantly faster.
Software-wise, I built a Linux kernel using the non-upstream repository (5.18-based for VisionFive 1, and 5.15-based for VisionFive 2). I built a Debian rootfs using the Debian guide for VisionFive. That guide works almost the same way for VisionFive 2, but that (as well as the upstream status for kernel support) will be for another article.
For other systems used in the comparison, they mostly run Debian or Ubuntu, with a few exceptions (NixOS, Armbian).
CPU performance
Here are the three benchmarks I will use:
openssl speed -evp sha1
openssl speed -evp chacha20-poly1305
# https://cdn.kernel.org/pub/linux/kernel/v5.x/linux-5.10.tar.xz (116606704 bytes)
time xz -d < /dev/shm/linux-5.10.tar.xz > /dev/null
The xz benchmark uses decompression of a known file to ease
reproducibility, and this file is stored in memory (/dev/shm) to make
sure we have no disk I/O.
All benchmarks are using a single CPU core.
I converted all results into MB/s for easier comparison, taking the
largest block size for the openssl results (16 KiB). As a reminder, one
MB equals 1000000 bytes. For the xz benchmark, the real elapsed time is
used.
To ease comparisons with other hardware, I computed a "speedup" of each
board compared to the VisionFive 2: 1x means the same performance, 2x
means twice as fast, 0.33x means three times as slow, etc.
You can find the full output of the benchmarks for each machine here.
Most hardware is either running locally, from the Compile Farm, or from Grid'5000. The Celeron G1840T system belongs to Deuxfleurs. The Kobol Helios64 result is from Max. Raspberry Pi 3B+ and 4 are courtesy of $DAYJOB. Raspberry Pi 5 result is from Denis.
| Hardware | sha1 | chacha20 | xz decompr. |
|---|---|---|---|
| RISC-V | |||
| VisionFive 2 Debian unstable | 97.5 MB/s | 50.8 MB/s | 4.66 MB/s |
| VisionFive 1 (gcc91) Debian unstable | 64.1 MB/s (0.66x) | 33.0 MB/s (0.65x) | 2.68 MB/s (0.58x) |
| HiFive Unmatched gcc92, Ubuntu 22.04 | 34.7 MB/s (0.36x) | 40.6 MB/s (0.80x) | 3.12 MB/s (0.67x) |
| ARM / ARM64 | |||
| Raspberry Pi 1 Debian 11, armv6l | 27.3 MB/s (0.28x) | 22.9 MB/s (0.45x) | 0.928 MB/s (0.20x) |
| Raspberry Pi 3B Debian 11 | 149 MB/s (1.53x) | 188 MB/s (3.70x) | 4.35 MB/s (0.93x) |
| Raspberry Pi 3B+ Debian 11 | 174 MB/s (1.79x) | 225 MB/s (4.44x) | 5.02 MB/s (1.08x) |
| Raspberry Pi 4B Debian 11 | 192 MB/s (1.97x) | 266 MB/s (5.24x) | 6.82 MB/s (1.46x) |
| Raspberry Pi 5 RaspiOS, Debian 12 | 1437 MB/s (14.7x) | 703 MB/s (13.9x) | 14.4 MB/s (3.09x) |
| Kobol Helios64 Armbian 22.02.1 | 979 MB/s (10x) | 323 MB/s (6.36x) | 7.64 MB/s (1.64x) |
| Ampere eMAG gcc185, CentOS 8 | 903 MB/s (9.26x) | 296 MB/s (5.83x) | 12.3 MB/s (2.64x) |
| Mac M1 gcc103, Debian 12 | 2244 MB/s (23x) | 1710 MB/s (33.7x) | 21.0 MB/s (4.51x) |
| x86_64 | |||
| Celeron G1840T NixOS 22.11 | 599 MB/s (6.14x) | 678 MB/s (13.3x) | 11.2 MB/s (2.40x) |
| Xeon Gold 6130 dahu.g5k, Deb. 11 | 1045 MB/s (10.7x) | 2611 MB/s (51.4x) | 17.1 MB/s (3.67x) |
| i7-8086K Ubuntu 20.04 | 1414 MB/s (14.5x) | 2971 MB/s (58.5x) | 22.6 MB/s (4.85x) |
| AMD EPYC 7642 neowise.g5k, Deb. 11 | 1706 MB/s (17.5x) | 1796 MB/s (35.4x) | 17.0 MB/s (3.65x) |
| AMD EPYC 7513 grat.g5k, Deb. 11 | 1875 MB/s (19.2x) | 2460 MB/s (48.4x) | 21.3 MB/s (4.57x) |
SHA1 and Chacha20-poly1305 results are very variable, which may be due to
optimizations in certain versions of OpenSSL (vectorisation, assembly
implementation) or even hardware acceleration for SHA1. They also seem to
be sensitive to memory bandwidth: the Raspberry Pis have much better
memory bandwidth than the RISC-V boards. In contrast, xz results seem
much more representative of raw CPU performance (clock frequency, CPU
cache, out-of-order execution, memory access patterns...)
To get clock frequency out of the equation, I am now showing xz results
normalized by the clock frequency, measured in "CPU cycles per processed byte"
(basically dividing clock frequency by xz performance). It should give an
idea of the overall performance of the CPU architecture for this specific
decompression task. Beware, lower values are now better!
| Hardware | Max clock frequency | xz -d cycles/byte(lower is better) |
|---|---|---|
| VisionFive 2 | 1.50 GHz | 322 |
| VisionFive 1 | 1.20 GHz | 448 (0.72x) |
| HiFive Unmatched | 1.20 GHz | 385 (0.84x) |
| Raspberry Pi 1 | 0.70 GHz | 754 (0.43x) |
| Raspberry Pi 3B | 1.20 GHz | 276 (1.17x) |
| Raspberry Pi 3B+ | 1.40 GHz | 279 (1.15x) |
| Raspberry Pi 4B | 1.50 GHz | 220 (1.46x) |
| Raspberry Pi 5 | 2.40 GHz | 167 (1.93x) |
| Kobol Helios64 | 1.80 GHz | 236 (1.37x) |
| Ampere eMAG | 3.00 GHz | 244 (1.32x) |
| Mac M1 | 3.00 GHz | 143 (2.25x) |
| Celeron G1840T | 2.50 GHz | 223 (1.44x) |
| Xeon Gold 6130 | 3.70 GHz | 216 (1.49x) |
| i7-8086K | 5.00 GHz | 221 (1.45x) |
| AMD EPYC 7642 | 3.30 GHz | 194 (1.66x) |
| AMD EPYC 7513 | 3.65 GHz | 171 (1.88x) |
Here are some of the main highlights of these results:
- VisionFive 2 single-core performance is 52% to 74% higher than VisionFive 1. This is very good compared to the 25% clock frequency improvement. When normalizing by the clock frequency, the VisionFive 2 is 39% faster per MHz compared to the VisionFive 1
- VisionFive 2 is also 25% to 50% faster than the HiFive Unmatched. When normalizing by the clock frequency, the VisionFive 2 is 20% faster per MHz compared to the Unmatched. The Unmatched was itself slightly faster than the VisionFive 1 on a single-core basis.
- VisionFive 2 is roughly as fast as a Raspberry Pi 3B/3B+ on the
xzbenchmark, but much slower for SHA1 and Chacha20. - VisionFive 2 is still around 1.5 slower than a Raspberry Pi 4 (and 5 times slower on Chacha20)
Here are other interesting insights:
- The Raspberry Pi 1 always felt really slow. Well, now I know it's objectively really slow. Even when taking into account its low clock frequency of 700 MHz, performance per MHz is still really poor.
- The Intel CPUs (from 2014, 2017 and 2018 respectively) have very similar performance per MHz for this task, despite being very different in terms of frequency, number of cores and price. This indicate that they basically share the same kind of architectural design.
- The Raspberry Pi 4 and the Helios64 have good performance per MHz for a SoC, even comparable to an $1900 Intel CPU from 2017! Of course, the Intel CPU has much more cores, and there may be other workloads where Intel CPUs are much better.
- The AMD EPYC CPUs (Zen 2 and Zen 3) have very good performance per MHz for this workload, and there is a clear improvement from Zen 2 to Zen 3.
- The Raspberry Pi 5 has roughly the same performance per MHz as a Zen 3 CPU, which is really impressive.
- As always, despite being already a few years old, the Mac M1 is even more impressive and easily smashes all other processors I could test on a per-MHz basis.
As a final note: remember that this is a single benchmark and is not
representative of all kind of computing workloads. I suspect xz to be
quite sensitive to the amount of CPU cache and to memory latency.
Energy consumption
Now that we have an idea of CPU performance, the other important criteria is energy consumption. Here, I am interested in whole-system energy consumption. I could only measure it for systems I have locally, so only a subset of the previous machines are tested here. Technically, I could have used wattmeters available on Grid'5000, but it makes little sense to compare the power consumption of a big server with that of a small embedded board.
All figures below are taken using a basic Perel plug-in wattmeter on 230V. The wattmeter gives the "active" (or real) power in Watts, as well as the power factor. All figures include the power transformer, which is either: an Akashi ALT2USBACCH USB transformer designed for up to 2.4A (VisionFive 1 & 2, Raspberry Pis) ; the stock Lenovo power transformer (Celeron G1840T) ; or an ATX power supply (HiFive Unmatched, i7-8086K).
For each system, I measure power consumption in the following situations: idle ; 1 CPU core at 100% ; half of CPU cores at 100% ; all CPU cores at 100% (ignoring hyper-threads). Each measurement is run for only a few seconds (still waiting for a steady-state) to avoid thermal throttling.
The workload is a simple infinite loop in bash: while :; do :; done.
All systems run Linux (various versions and distributions), have one NIC
up, and no screen or other peripheral attached.
Note: I am not very confident in the absolute power values shown below (because I don't really trust the wattmeter or the USB transformer). However, since I did all measurements in the same conditions, the values are comparable with each other.
| Hardware | Idle | 1 core | Half cores | All cores |
|---|---|---|---|---|
| VisionFive 2 4 cores, 8 GB RAM | 7.4 W | 10.4 W | 11.2 W | 13.1 W |
| VisionFive 1 2 cores, 8 GB RAM | 10.6 W | 11.1 W | - | 11.6 W |
| HiFive Unmatched 4 cores, 16 GB RAM | 56.8 W | 57.7 W | 58.6 W | 60.7 W |
| Raspberry Pi 1 1 core, 512 MB RAM | 5.9 W | 6.2 W | - | - |
| Raspberry Pi 3B rev 1.2 4 cores, 1 GB RAM | 4.5 W | 6.5 W | 8.7 W | 13.8 W |
| Raspberry Pi 3B+ 4 cores, 1 GB RAM | 7.0 W | 9.7 W | 12.2 W | 18.0 W |
| Raspberry Pi 4B rev 1.5 4 cores, 2 GB RAM | 4.6 W | 6.8 W | 8.3 W | 11.1 W |
| Celeron G1840T 2 cores | 12 W | 18 W | - | 23.5 W |
| i7-8086K 6 c. / 12 threads | 23.4 W | 61.5 W | 79.5 W | 112.7 W |
Clearly, the VisionFive 2 is quite power-efficient compared to the older RISC-V boards. According to its documentation, it can run without any headsink or fan for bursty loads (e.g. web browsing), but a fan is recommended for long computations. This is consistent with my power consumption measurements.
Interestingly, the Raspberry Pi 3B+ has a similar power profile as the VisionFive 2. This makes sense because they are in the same class of devices: same amount of cores, similar maximum clock frequency, similar performance. But it's still noteworthy that the relatively young SoC found on the VisionFive 2 has a power consumption that is so similar to that of the more mature SoC found on the Raspberry Pi 3B+.
We can also observe that Intel is much better at dynamic frequency scaling, which helps to achieve low power usage when the CPU is idle. As far as I know, the SoC in the VisionFive 1 and the HiFive Unmatched have no frequency scaling, which explains their near-constant power usage. The VisionFive 2 does have frequency scaling, so it's already much better (-45% power usage when idle compared to fully loaded).
Here are some details about the hardware to put these numbers into context:
- VisionFive 1: no fan, kernel 5.18 (Debian). Power consumption changes significantly with die temperature (9 W idle at 36 °C, 10.4 W idle at 50 °C)
- VisionFive 2: no fan, kernel 5.15 (Debian), no NVMe, 100M NIC. Using the gigabit NIC would add 0.5 W of power usage.
- Raspberry Pi 3B: rev 1.2, 1 GB RAM, no fan, kernel 5.10 (Debian 10). 600 MHz idle frequency, 1.20 GHz max frequency.
- Raspberry Pi 3B+: 1 GB RAM, no fan, kernel 5.10 (Debian 10). 600 MHz idle frequency, 1.40 GHz max frequency.
- Raspberry Pi 4B: rev 1.5, 2 GB RAM, no fan, kernel 5.10 (Debian 10). 600 MHz idle frequency, 1.50 GHz max frequency.
- Celeron G1840T: 800 MHz idle frequency, 2.5 GHz max frequency. Lenovo ThinkCentre M73, 4 GB DDR3, ST500LM021-1KJ15 disk.
- i7-8086K: 800 MHz idle frequency, 4 GHz max frequency, 5 GHz turbo frequency. ASRock H310CM-HDV/M.2 motherboard, 16 GB + 8 GB DDR4, Samsung 980 500GB NVMe, ATX power supply, 2 case fans
Note: earlier versions of this article used some POE power measurements from a switch (for the Raspberry Pis, with the POE hat). After re-doing the measurements with the USB power supply and plug-in wattmeter, it turns out that power measurements given by the POE switch were substantially lower than the wattmeter (probably because the POE switch measurements do not include the AC-to-DC power converter). Moreover, POE values were not stable. In the end, I decided to remove these POE values and only use the USB power supply to enable a fair comparison.
CPU performance vs. energy
Now that we have both CPU performance and energy consumption, we can mix
the two results to look at energy efficiency. The most reliable figure in
the table below is single-core efficiency: it is obtained by simply
dividing the result of the single-core performance benchmark for xz by
the single-core power consumption. I also extrapolate some figures for
all-cores efficiency, but this value should be taken with a grain of
salt: it is obtained by multiplying single-core performance by the number
of cores (excluding hyper-threads) and dividing the total by the measured
all-cores power consumption. Many effects such as thermal throttling,
frequency boost for single-core load, and shared cache between cores may
decrease the actual all-cores performance and thus decrease the actual
all-cores efficiency compared to the figures below.
| Hardware | Single-core efficiency | All-cores efficiency (extrapolated) |
|---|---|---|
| VisionFive 2 (4 cores) | 0.448 MB/s/W | 1.42 MB/s/W |
| VisionFive 1 (2 cores) | 0.241 MB/s/W | 0.462 MB/s/W |
| HiFive Unmatched (4 cores) | 0.0541 MB/s/W | 0.206 MB/s/W |
| Raspberry Pi 1 (1 core) | 0.150 MB/s/W | |
| Raspberry Pi 3B (4 cores) | 0.670 MB/s/W | 1.26 MB/s/W |
| Raspberry Pi 3B+ (4 cores) | 0.517 MB/s/W | 1.12 MB/s/W |
| Raspberry Pi 4B (4 cores) | 1.00 MB/s/w | 2.46 MB/s/W |
| Celeron G1840T (2 cores) | 0.622 MB/s/W | 0.953 MB/s/W |
| i7-8086K (6 c. / 12 threads) | 0.367 MB/s/W | 1.20 MB/s/W |
Overall, the VisionFive 2 is much more energy-efficient than existing RISC-V boards: it is 2 to 3 times more energy-efficient than the VisionFive 1, and 7 to 8 times more energy-efficient than the Unmatched. It may seem counter-intuitive that the Unmatched is so inefficient, but that's probably because of its larger form factor, power-hungry PCIe and DDR4, and the need for an ATX power supply that may not be super efficient at low power load.
Similarly, even though x86_64 hardware is much faster than the VisionFive 2 (2.4 times to 4.8 times faster), it has roughly the same energy efficiency! If you have moderate computing needs, the VisionFive 2 is an efficient alternative to bigger systems.
Compared to the Raspberry Pi 3B and 3B+, the VisionFive 2 again has similar energy-efficiency. This makes sense because it has roughly the same performance and the same power consumption.
Finally, the Raspberry Pi 4 is the real winner on the efficiency metric: the VisionFive 2 is half as energy-efficiency as a Raspberry Pi 4.
Conclusion
When looking at single-core CPU performance, the VisionFive 2 is roughly 75% faster than the original VisionFive. Since it has twice the core count, that means a +150% total performance increase. And since it has a similar power consumption, it is also 2 to 3 times more energy-efficient. So that's definitely a very big improvement.
Compared to the HiFive Unmatched (which is not even technically a SBC), the VisionFive 2 still outperforms it by 50%, and is 7 to 8 times more energy-efficient. So, as far as I can tell, the claim about it being a "high-performance RISC-V SBC" is true.
When comparing with Raspberry Pis, the VisionFive 2 is about as fast as a Raspberry Pi 3B+, although much slower on memory-heavy benchmarks, and also as energy-efficient. However, it is still 46% slower than a Raspberry Pi 4, and two times less energy-efficient. As far as I can tell, both SoC are 28 nm, so we would ideally expect the same energy-efficiency.
Compared to low-power x86_64 systems, the VisionFive 2 is of course slower when looking at raw performance, but at the same time it is as energy-efficient. This is a general advantage that SBCs have over more complete systems: they have much less peripherals, are less extensible and have generally lower performance, but they are much more energy-efficient.
Again, remember that all figures discussed here are approximate, and specific benchmark results cannot be extrapolated to generic performance results for all applications.
Overall, the VisionFive 2 is a big step in the right direction, and this kind of RISC-V hardware can definitely compete with recent ARM boards since they have very similar performance-energy tradeoffs.
More pictures
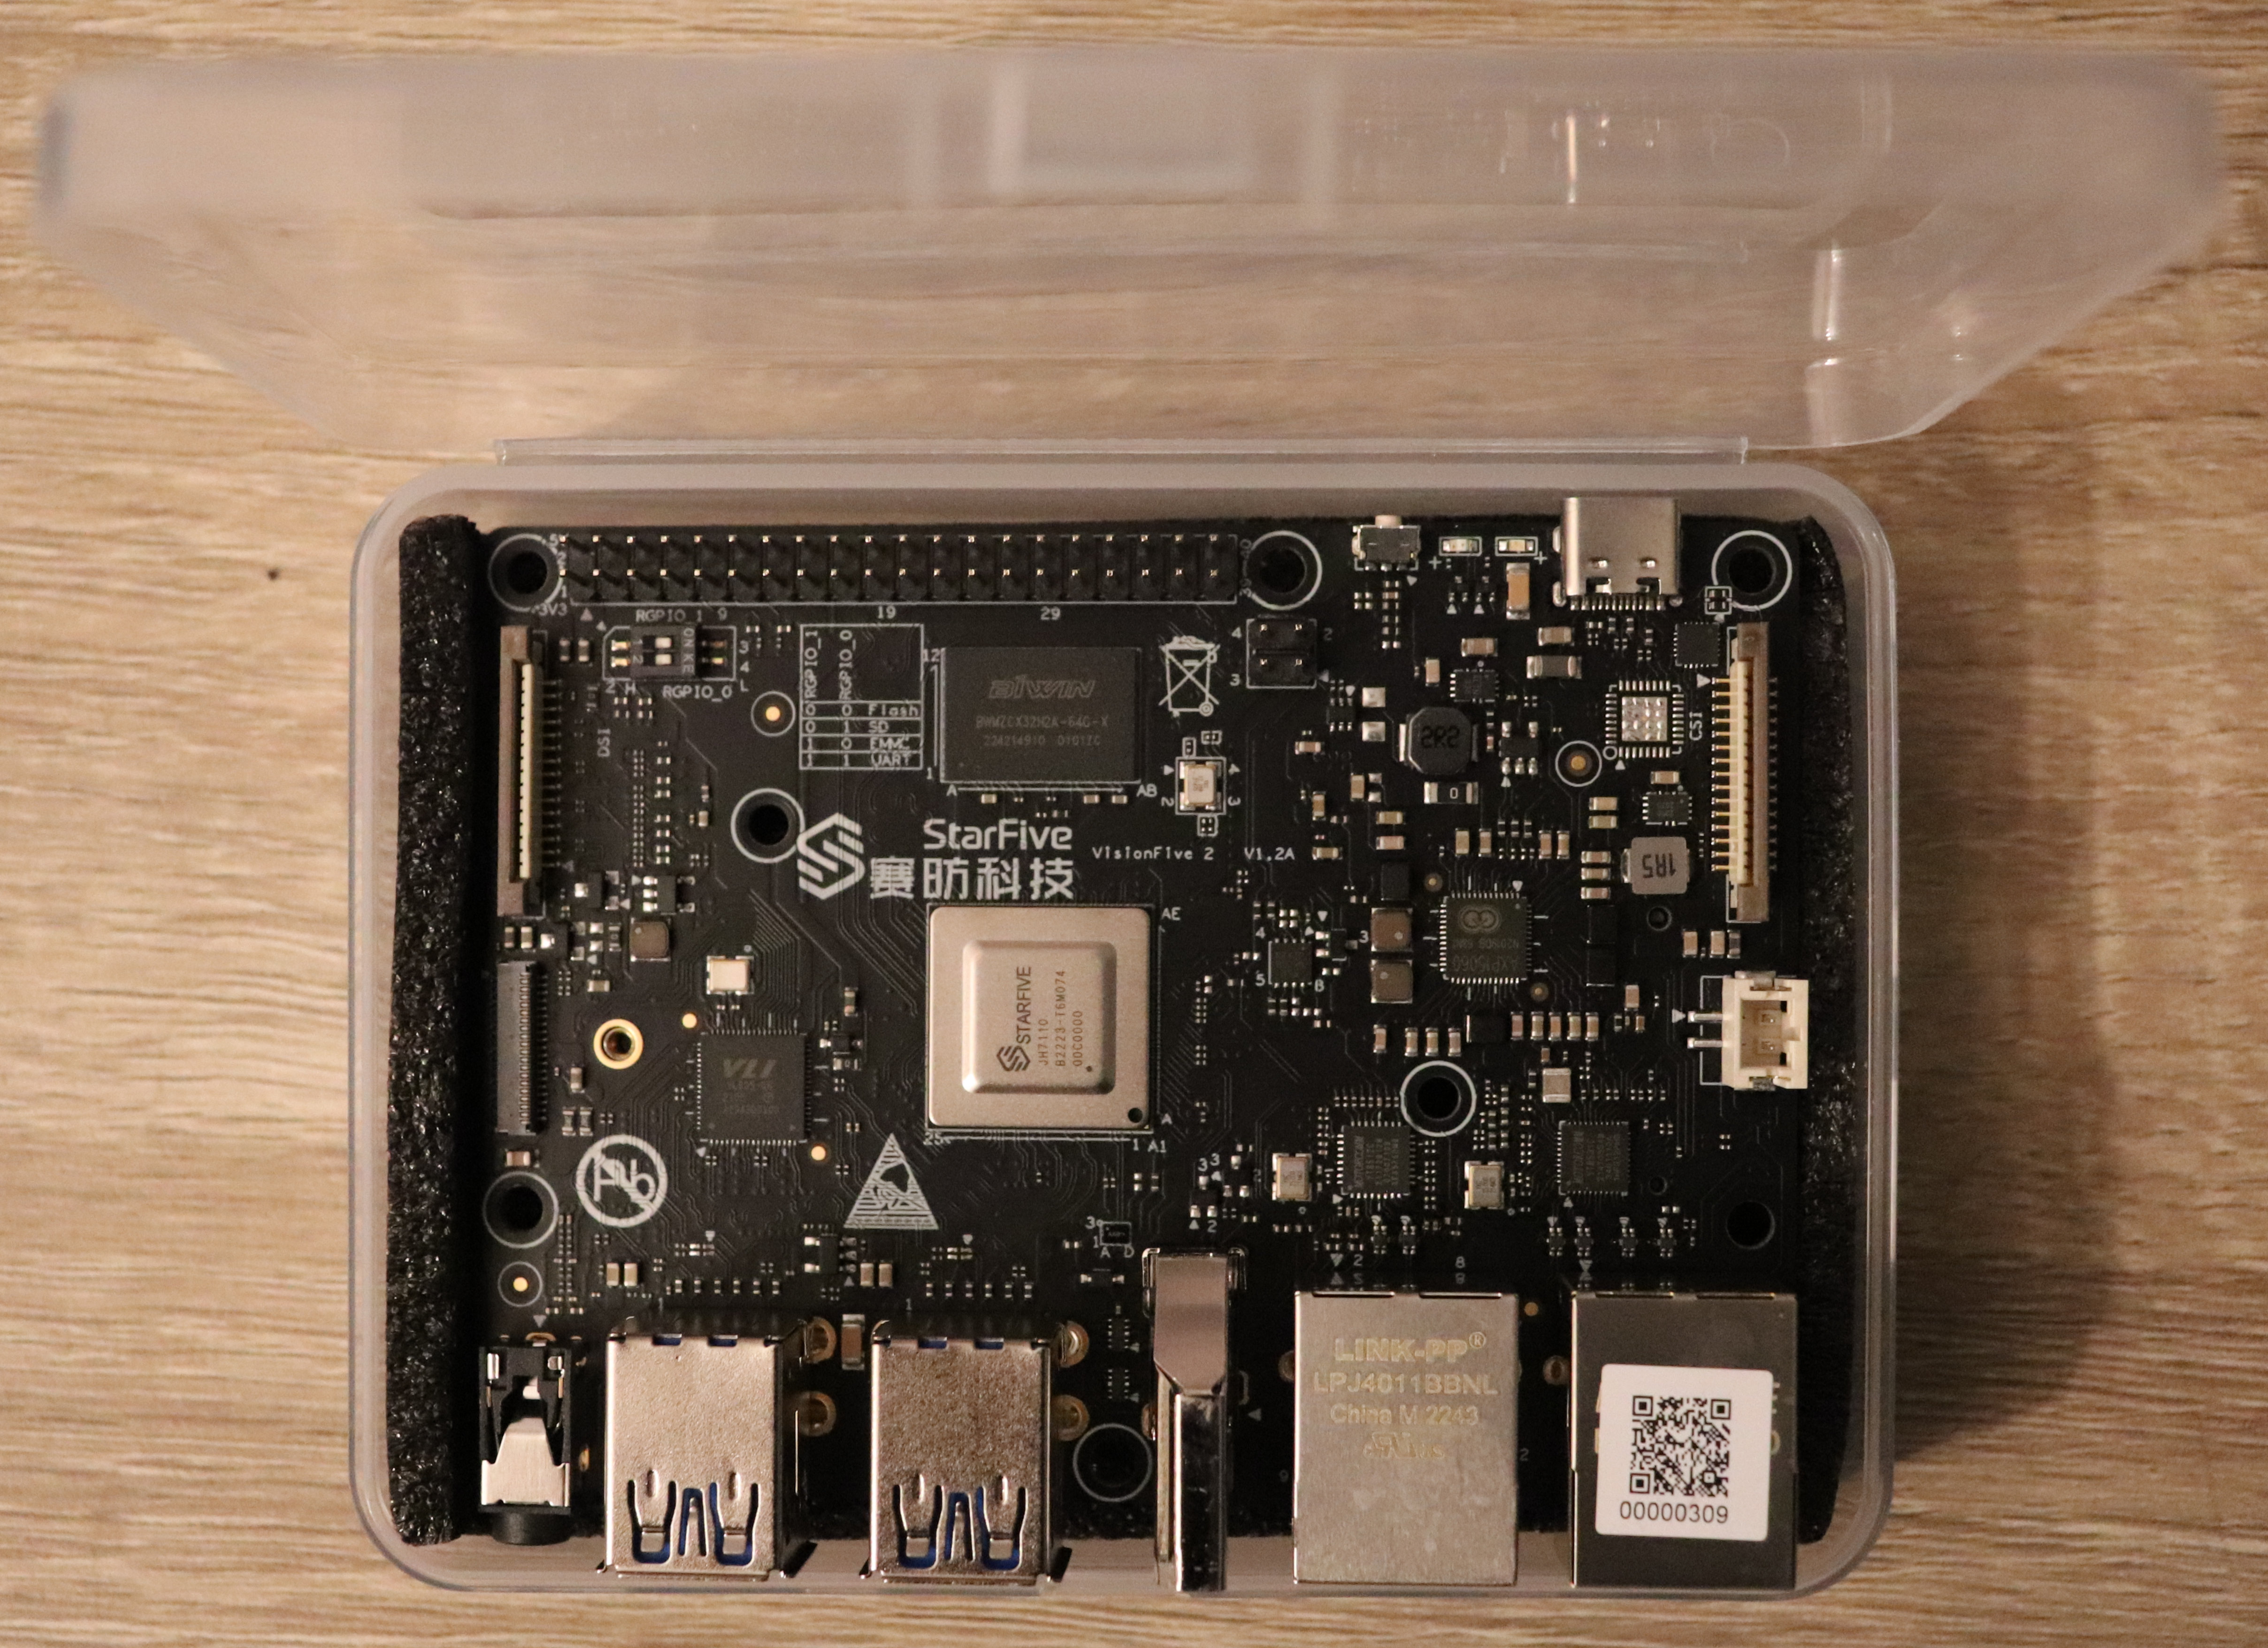
VisionFive 2 in its box (I removed the antistatic wrapping)
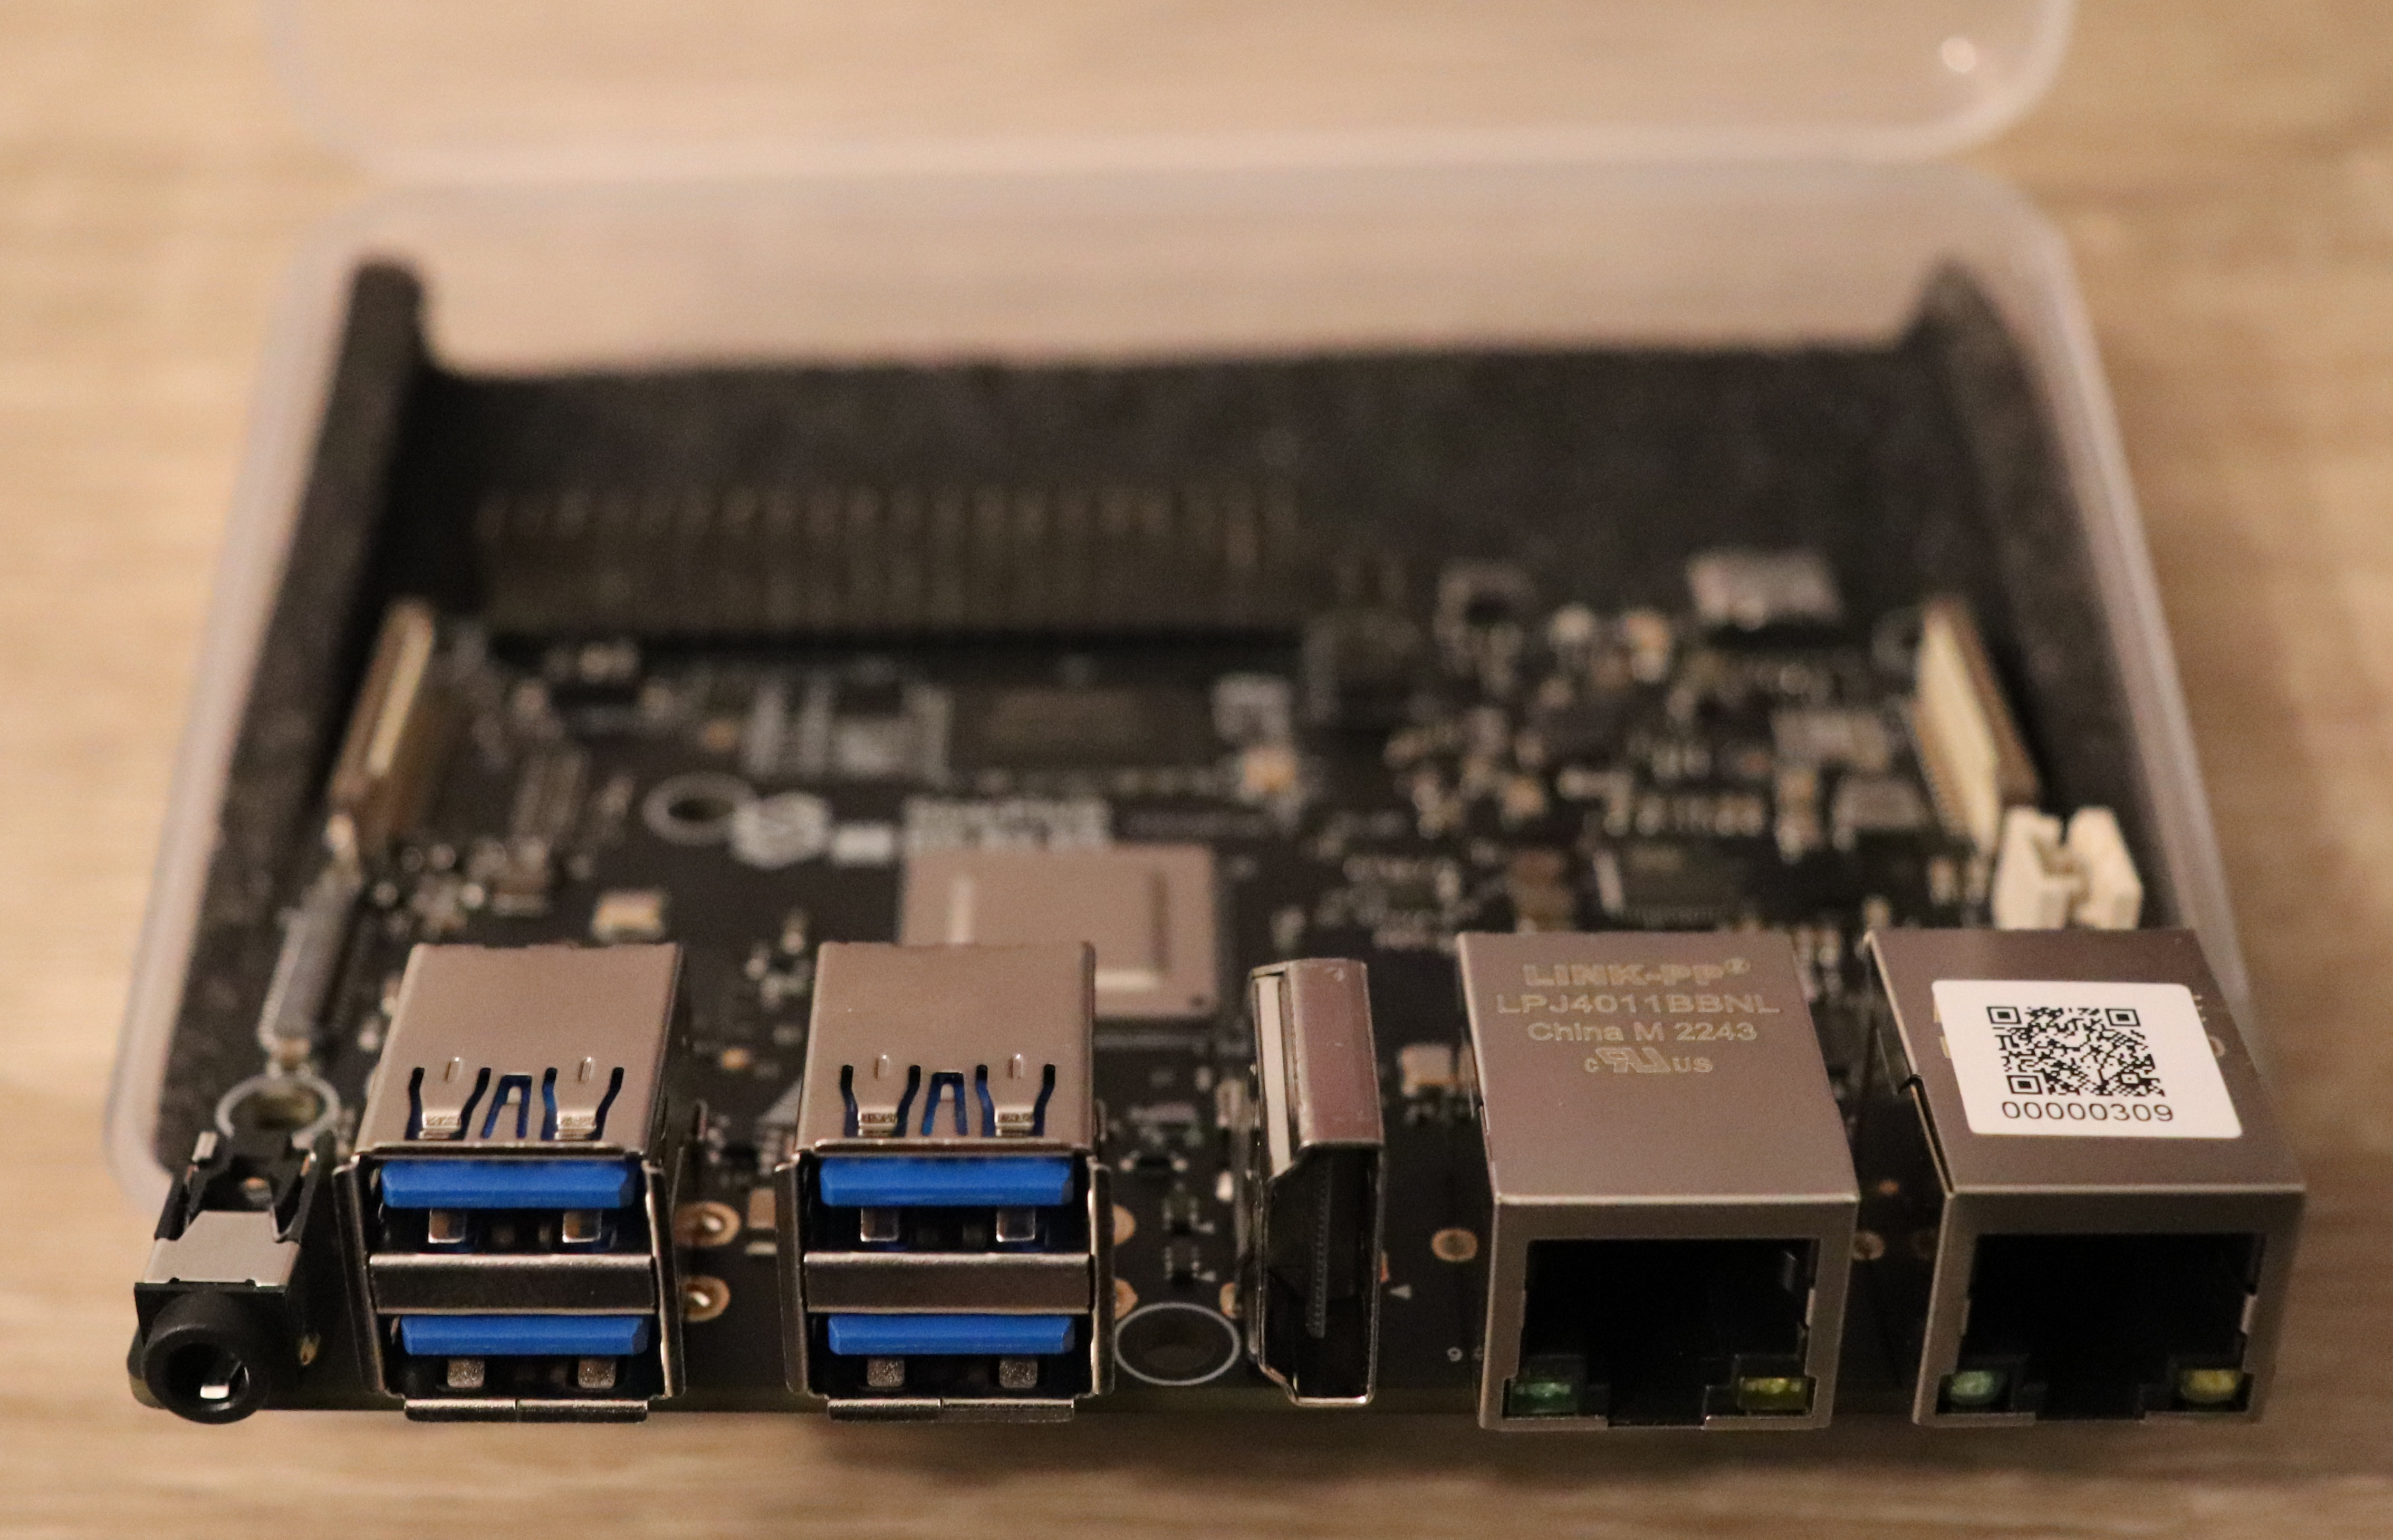
Front with audio, 4xUSB, HDMI, 2xNIC (with one being a 100M NIC, specific to the super early bird version)
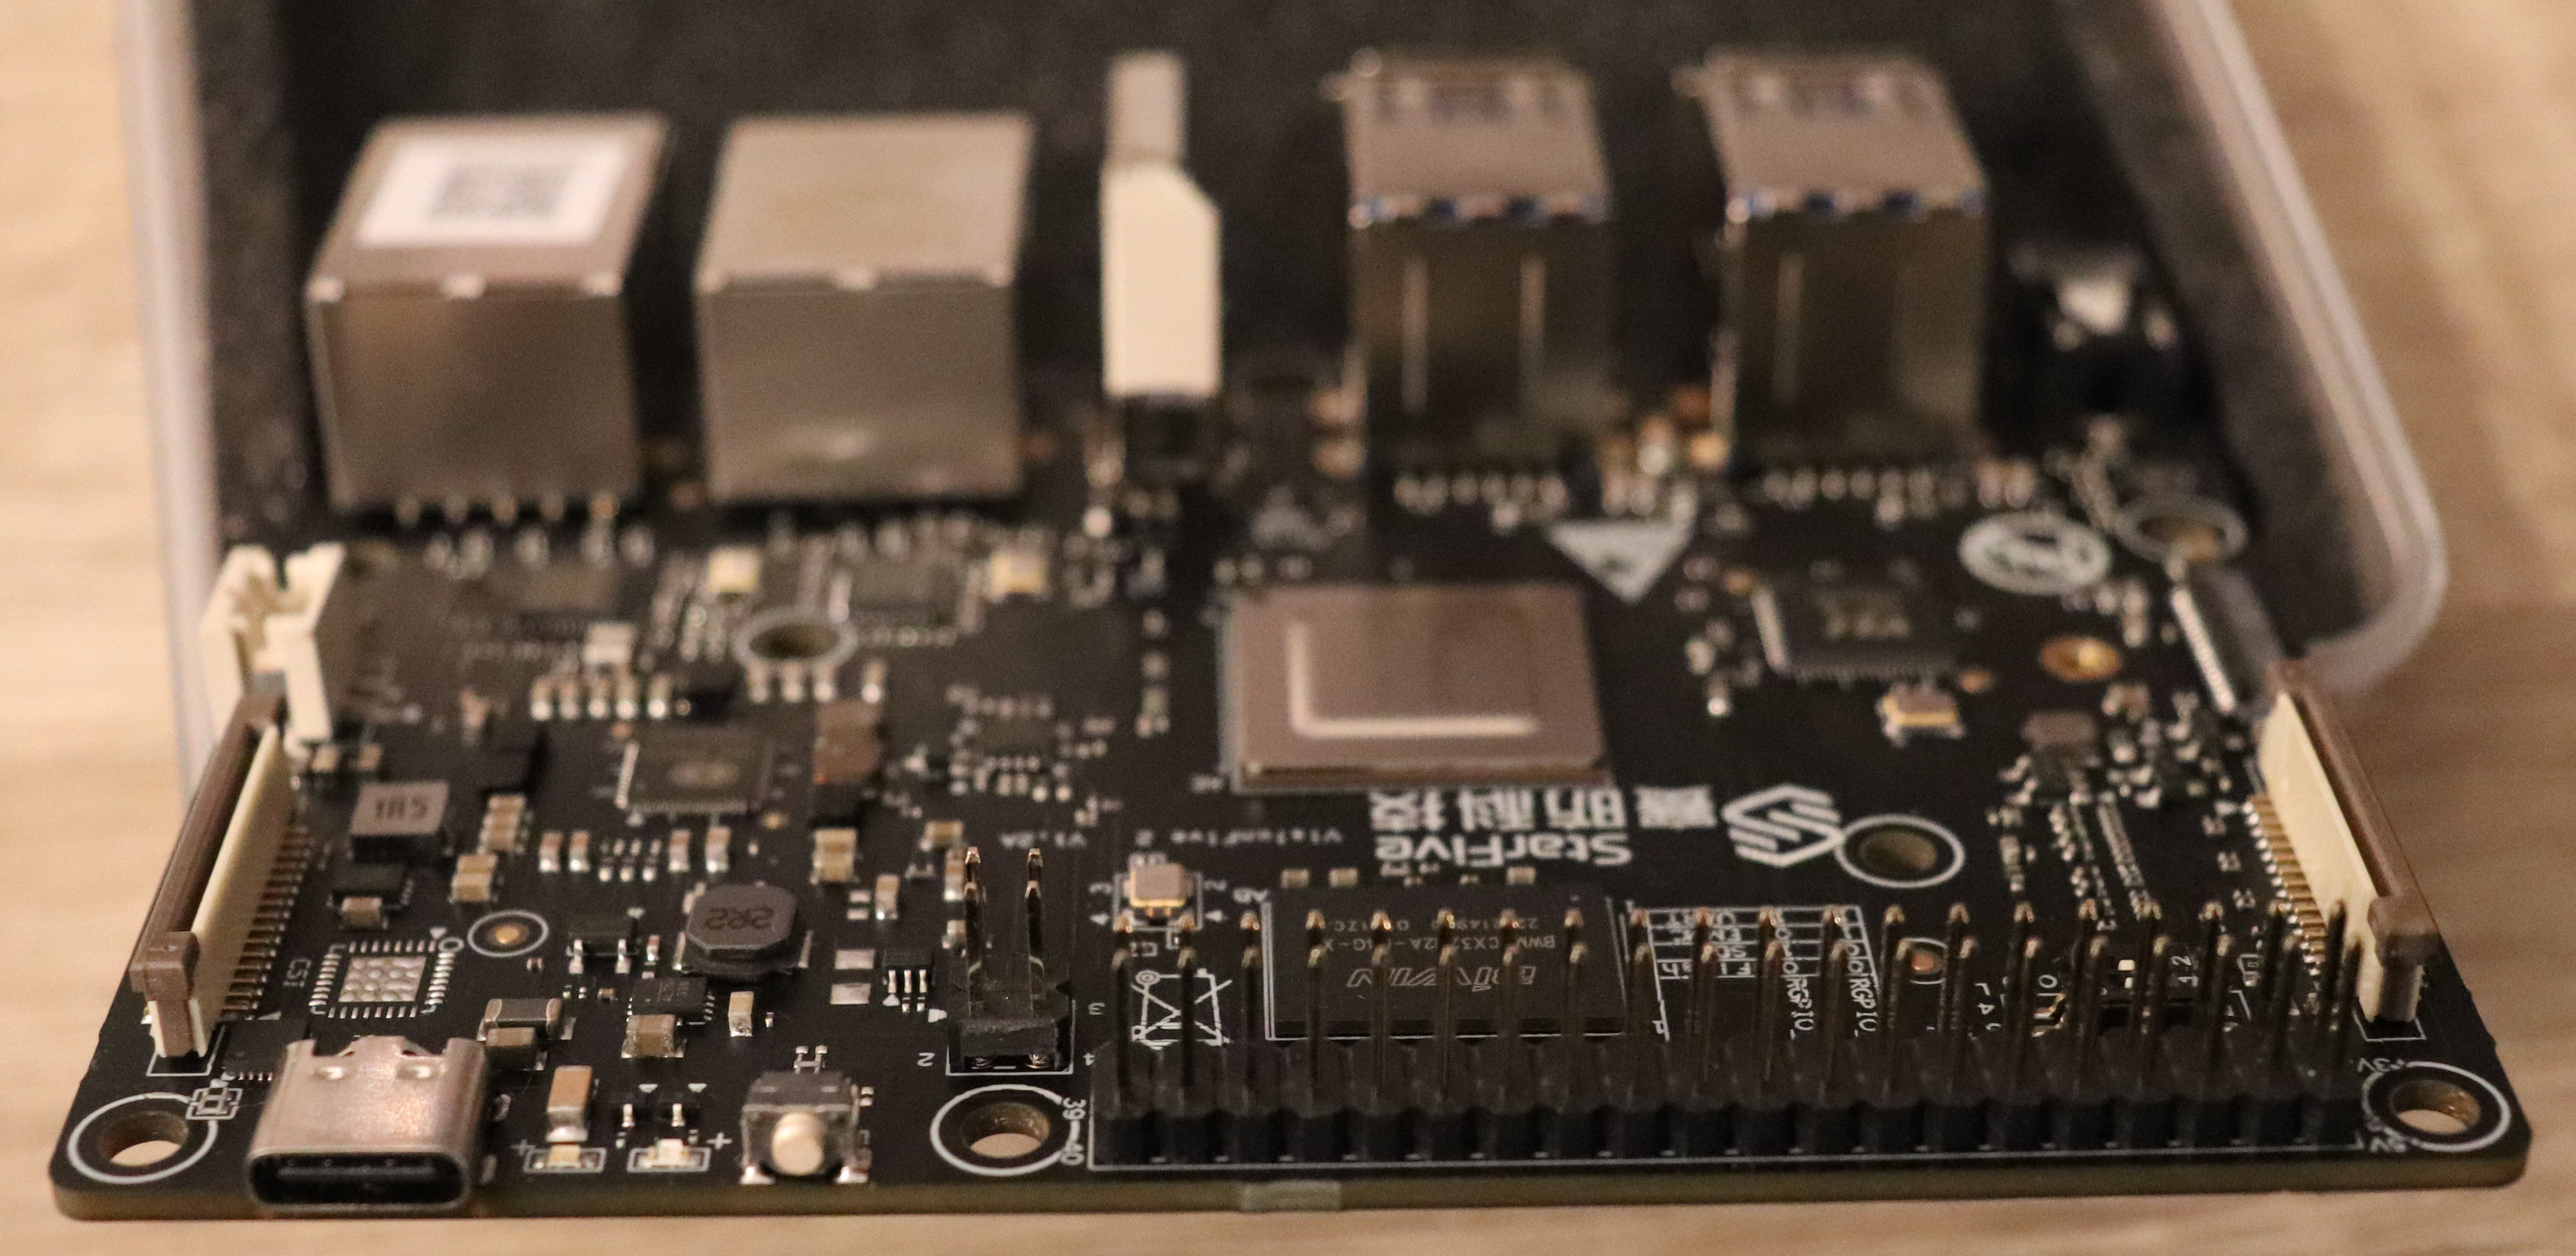
Rear with USB-C power input, reset button, GPIOs
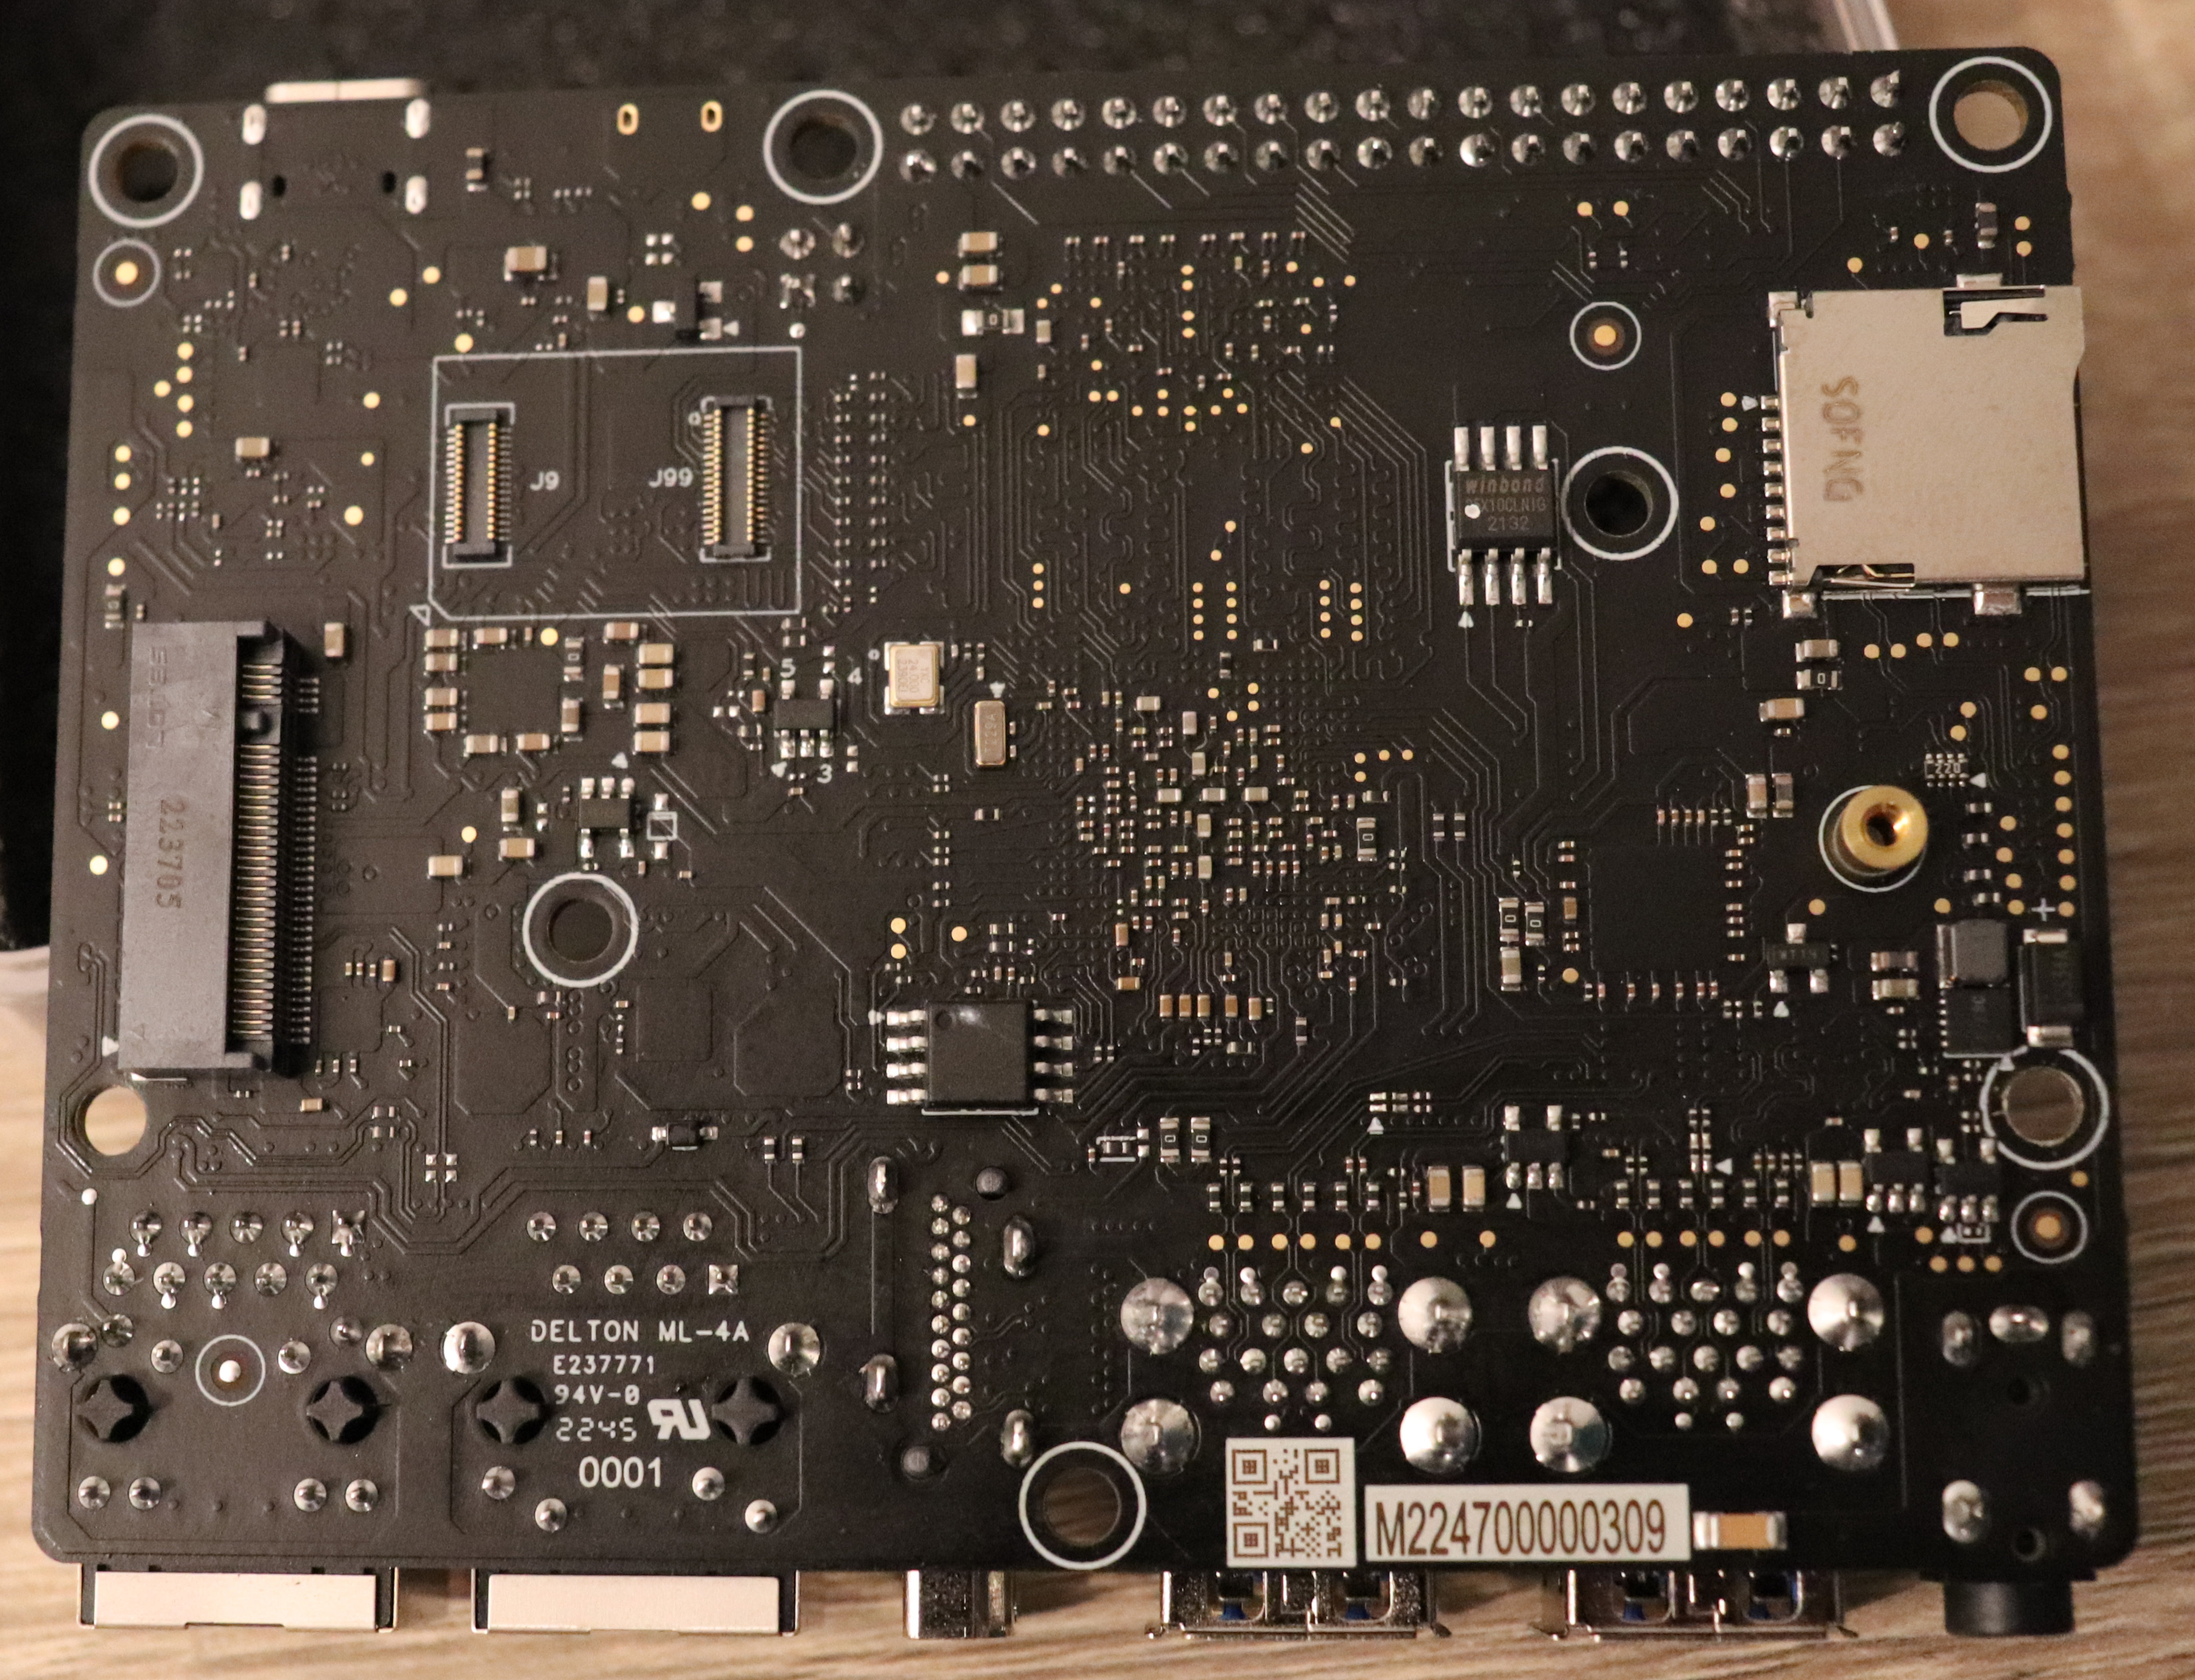
Back with NVMe M.2 slot, micro-SD card slot